BisQue
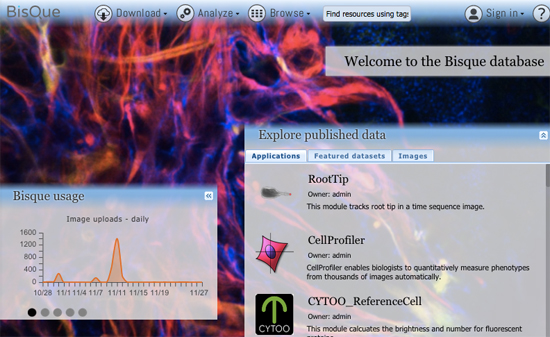
Bisque (Bio-Image Semantic Query User Environment) : Store, visualize, organize and analyze images in the cloud. Bisque was developed for the exchange and exploration of biological images. The Bisque system supports several areas useful for imaging researchers from image capture to image analysis and querying. The bisque system is centered around a database of images and metadata. Search and comparison of datasets by image data and content is supported. Novel semantic analyses are integrated into the system allowing high level semantic queries and comparison of image content.
Overview Points
- Bisque is free and open-source
- Flexible textual and graphical annotations
- Cloud scalability: PBs of images, millions of annotations
- Distributed storage: local, iRODS, S3
- Integrated image analysis, high-throughput with Condor
- Analysis in MATLAB, Python, Java+ImageJ
- 100+ biological image formats
- Very large 5D images (100+ GB)
Demos
Contact
- Email: bisque@ece.ucsb.edu
Documentation
- Reproducible computer vision. Cross-disciplinary and scalable image informatics (paper)
- Official Documentation
- Presentation Poster
Source Code
Features

CellProfiler Module Available
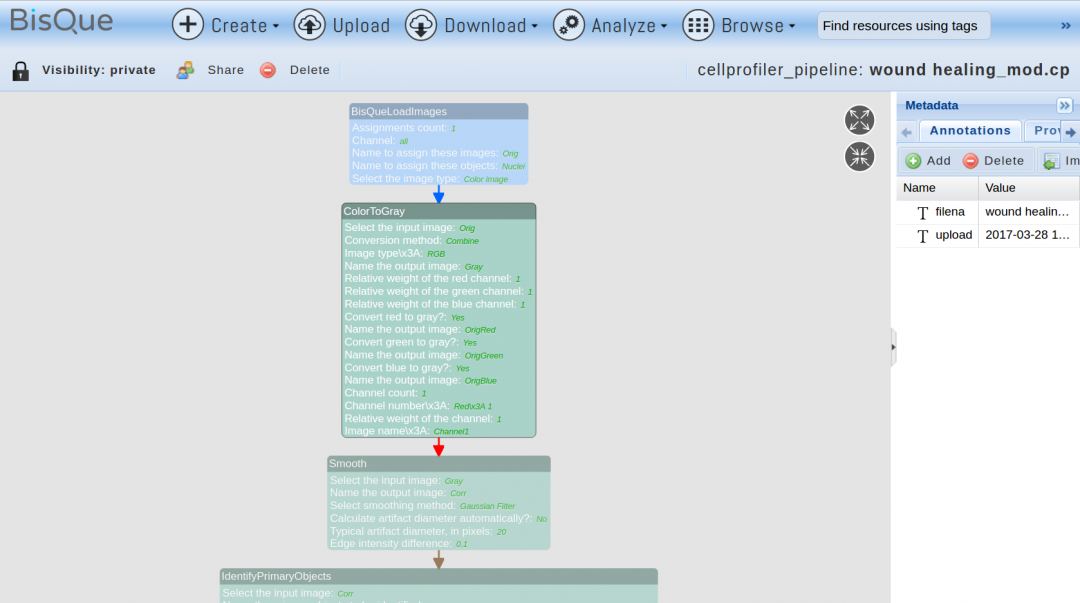
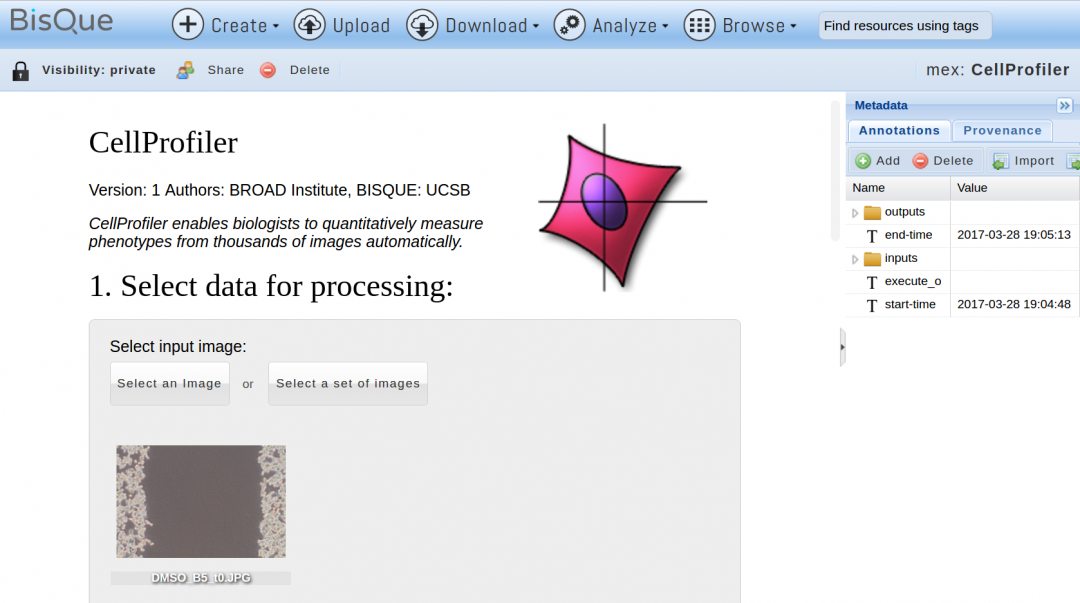
The latest version of BisQue integrates CellProfiler (http://cellprofiler.org/), a software for the quantitative analysis of biological images, developed at the Broad Institute. CellProfiler is designed for modular, flexible, high-throughput analysis of images, measuring size, shape, intensity, and texture of every cell (or other object) in one or more images. At the core of CellProfiler is the image analysis "pipeline", a series of steps that each perform an image processing function such as illumination correction, object identification (segmentation), and object measurement.
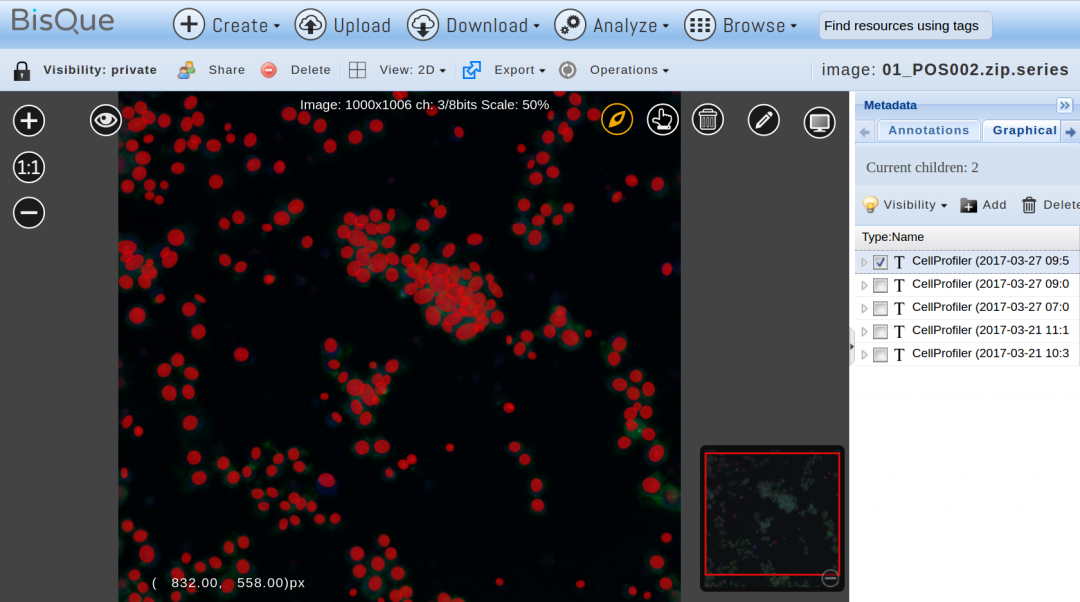
The new BisQue CellProfiler module allows to run arbitrary CellProfiler pipelines directly within BisQue. Pipelines are regular BisQue resources and can be viewed in the browser, annotated, and shared with others. The module can run any such pipeline on a single image or on a dataset of multiple images. BisQue's module execution system automatically parallelizes the execution on a compute cluster. Users can also run pipelines with parameter variations to study the effects of specific parameters. The results of a pipeline execution is stored back in BisQue as table and image resources linked to the module execution. Geometric entities stored in output tables (e.g., cell centroids) can automatically be overlayed as color-coded graphical objects with labels when viewing the image. Both generated tables and graphical objects can be processed further in additional BisQue modules or shared with other users.
Six example CellProfiler pipelines together with test images have already been uploaded into BisQue for convenience. These pipelines are: Human Cells, Fruit Fly Cells, Tumors, Comet Assay, Tissue Neighbors, and Wound Healing. Details on each of these examples can be found at http://cellprofiler.org/examples/.

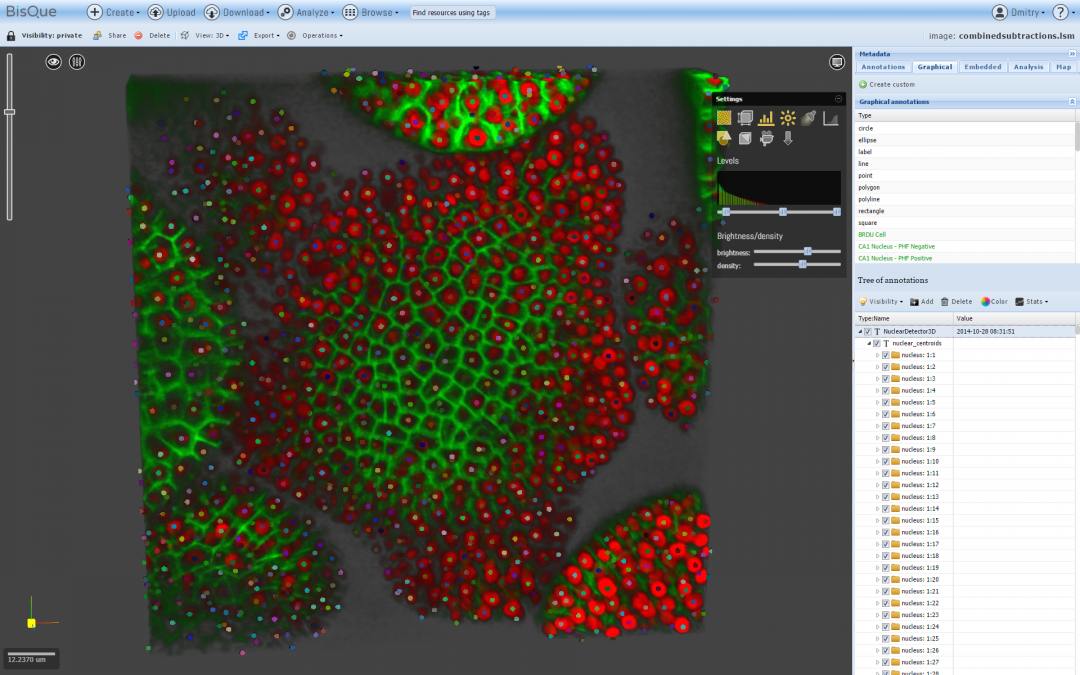
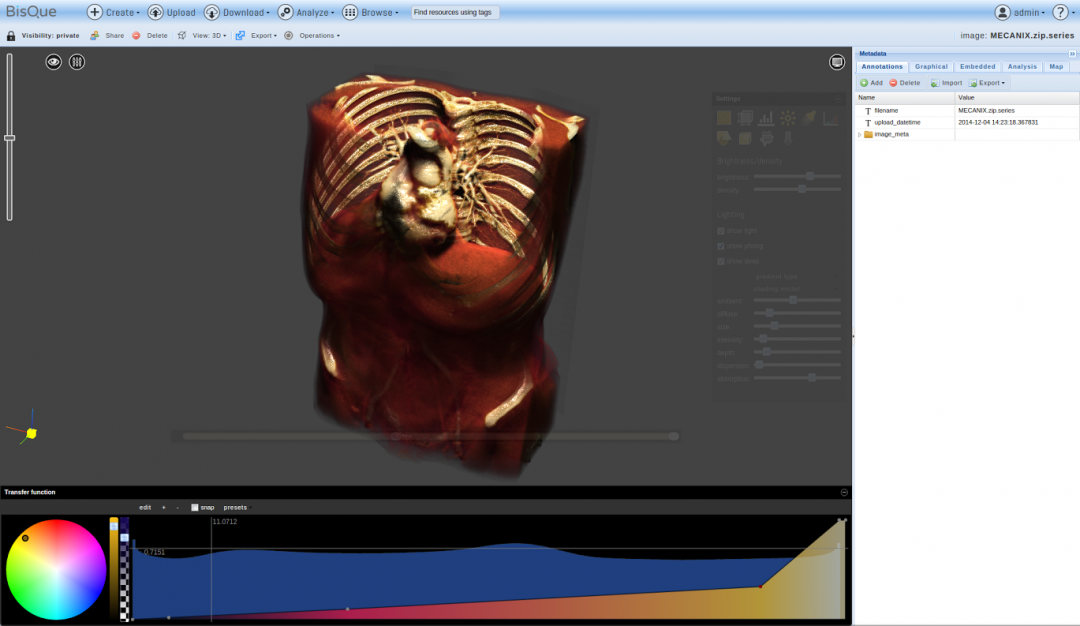
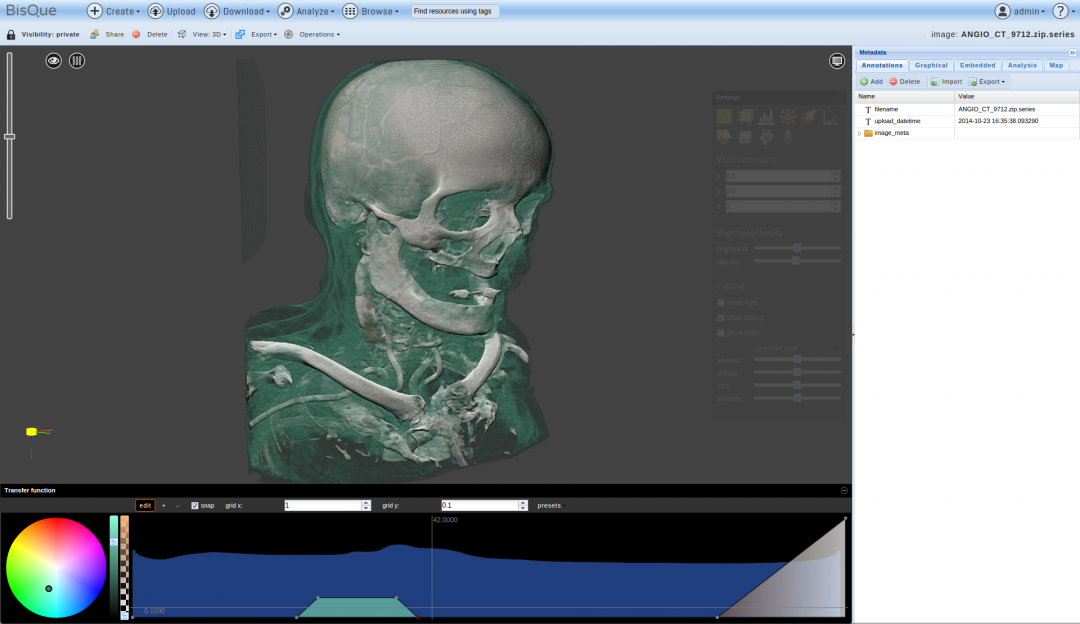
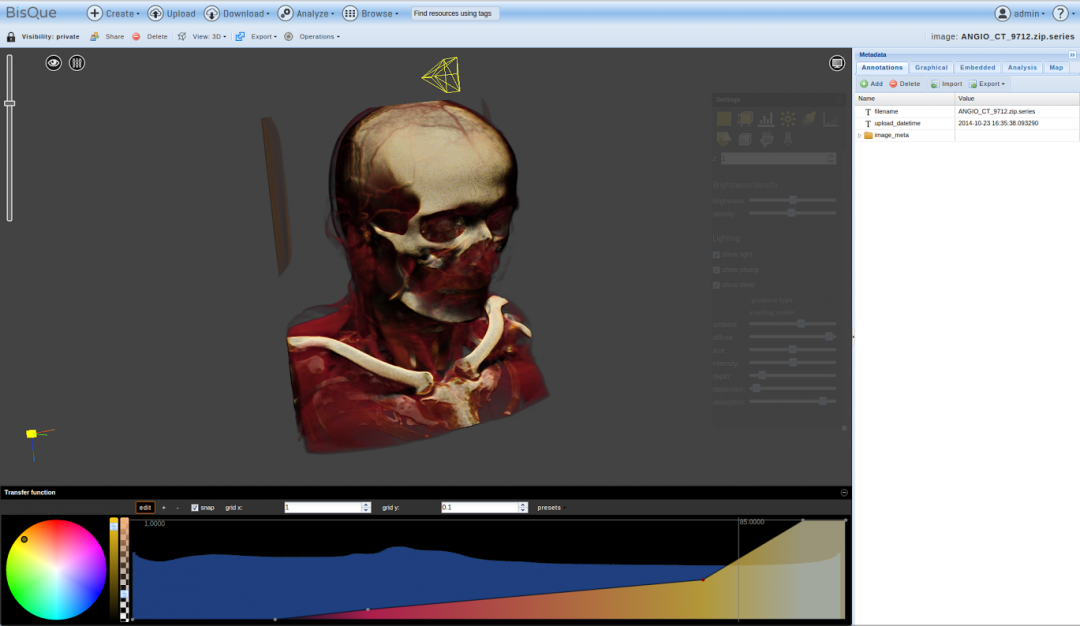
NEW! Volume Renderer
NEW in 0.5.7 release
The integrated 5D image viewer in addition to large planar view and movie view is able to present volumetric imagery in 3D with no plug-ins required! The brand new 3D volume renderer uses WebGL and operates on 5D imagery. It offers full channel fusion, intensity enhancements and editable transfer function with several presets. In addition it's possible to export screenshots and full videos with a predefined path right from your web browser.
Images (hover): image 1 | image 2 | image 3
Videos: Screen Capture | Video Export
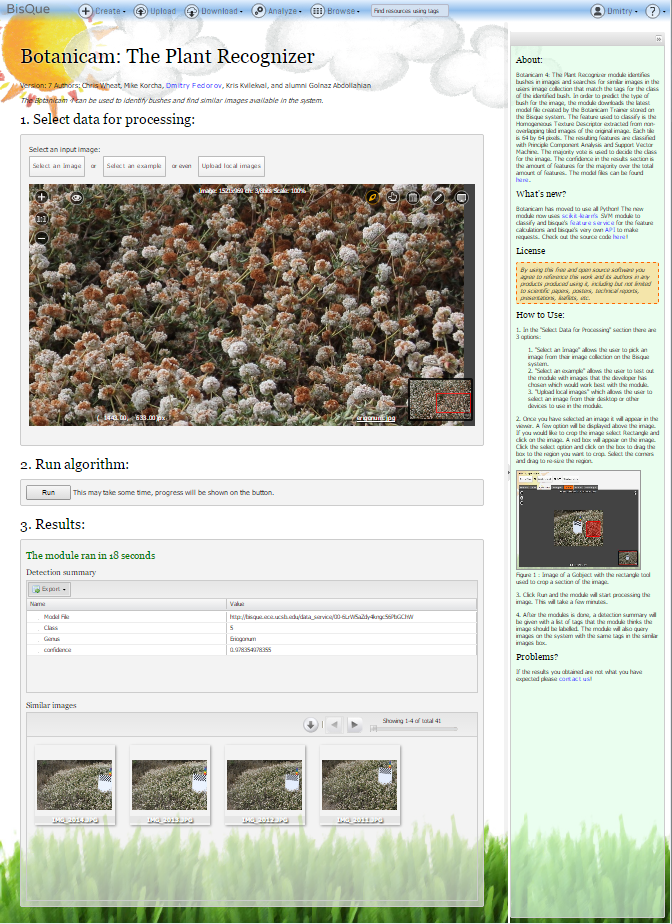
NEW! Feature Service
NEW in BisQue 0.5.7 release: The feature service is designed for developers working with image analysis and machine learning by providing infrastructure for distributed computation of numerical feature descriptors. The initial release version packs 100+ commonly used descriptors including MPEG7, OpenCV, Mahotas and WNDCHARM. The descriptor list includes HTD, SURF, CSD, etc. The Botanicam image recognition application was reengineered to utilize the feature service and serves as a great example of how to use it.
See more: http://biodev.ece.ucsb.edu/projects/bisquik/wiki/Developer/FeatureService
Images (hover): image 1
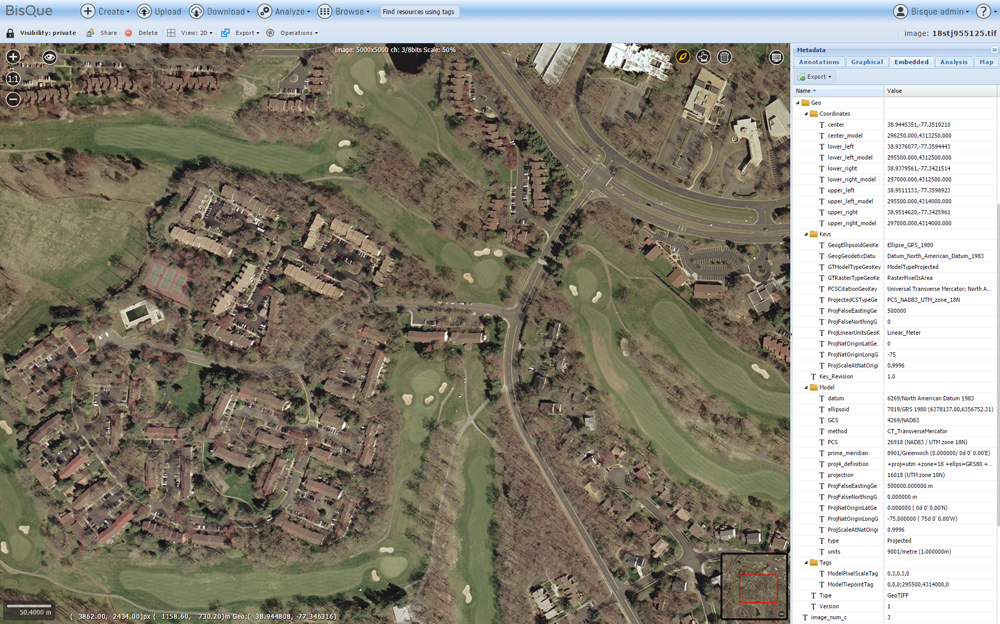
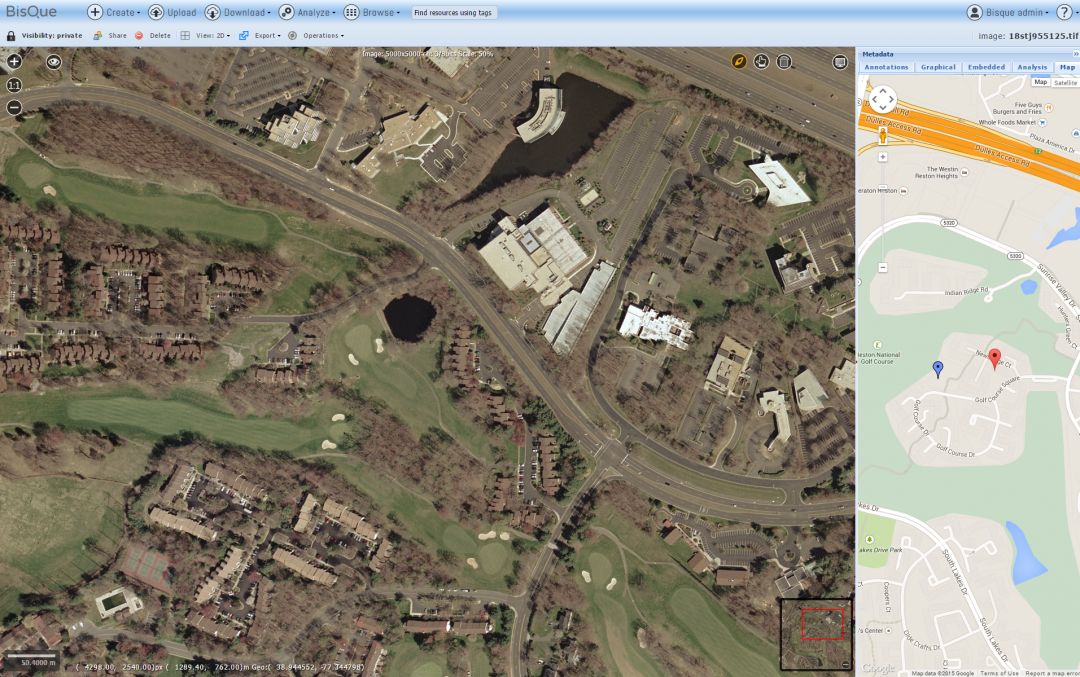
NEW! Geo Image Support
NEW in BisQue 0.5.7 release: This feature parses GeoTIFF metadata and enables the viewer UI to show geographical coordinates for orthorectified images. This also allows to export BisQue graphical annotations in KML format for visualization with Google Earth and for spatial analysis with external tools.
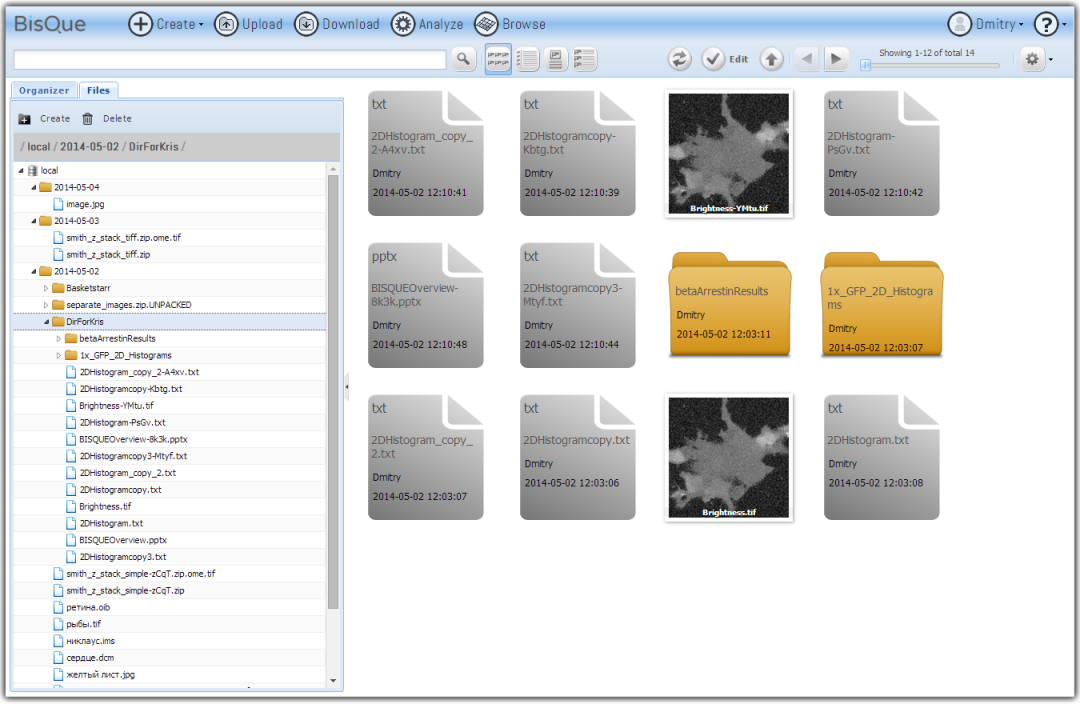
Full control of the directory tree
BisQue users can now control the cloud-based file storage to the level of directories. Resources are now organizable not only by Bisque annotations but also by the directory structure. This allows keeping exactly the same structure as on one's hard-drive. Uploading and downloading these structures is super easy and is fully supported in the Chrome browser. Users can now drag and drop directories directly into upload page, wrap all the files into a dataset and analyze it with a few clicks.
Images (hover): image 1
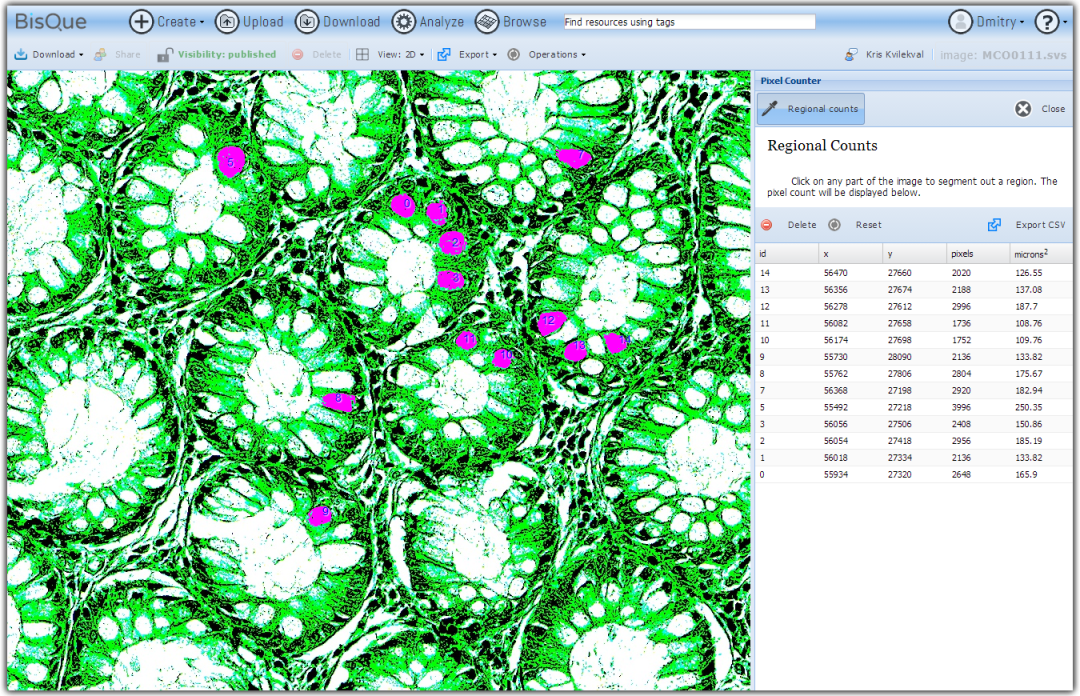
Image measurements in the web browser
The new BisQue web interface enables various image measurements directly in the browser. It's easy to measure length and area of any graphical object in pixels and physical units by simply drawing objects of interest and all the measurements will be displayed promptly in the viewer window. Moreover, BisQue enables rapid area estimation for any number of objects based on thresholding and segmentation. By using a Pixel Counter tool (found in Operations -> Pixel Counter) users can select a threshold value and click on objects of interest in order to segment them and append their area into the measurements list.
Images (hover): image 1
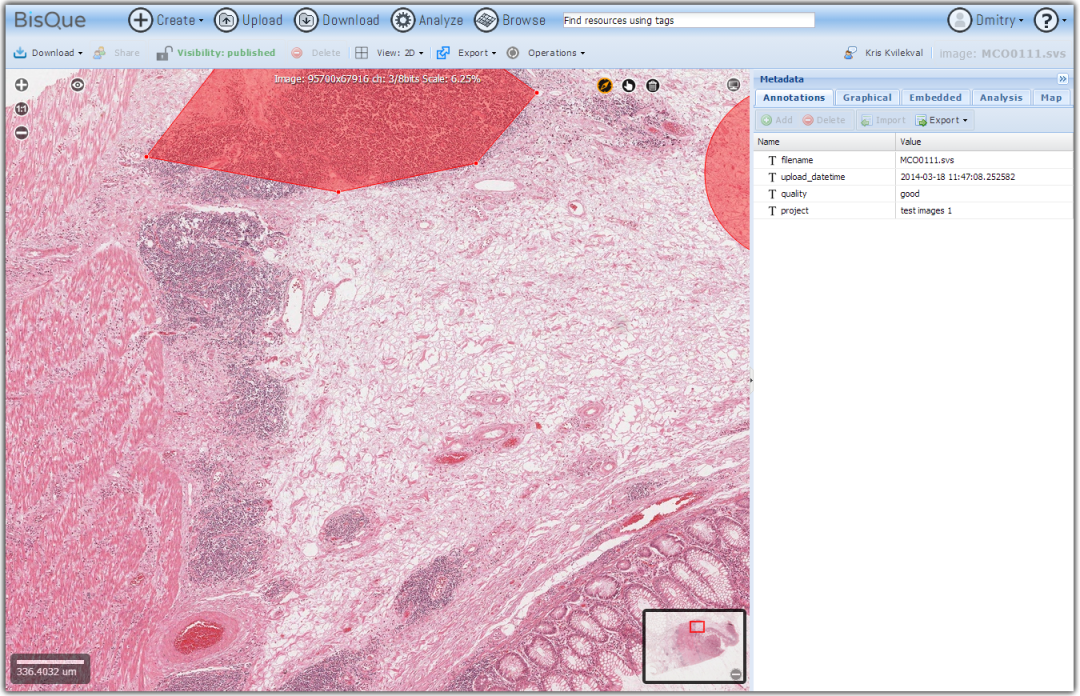
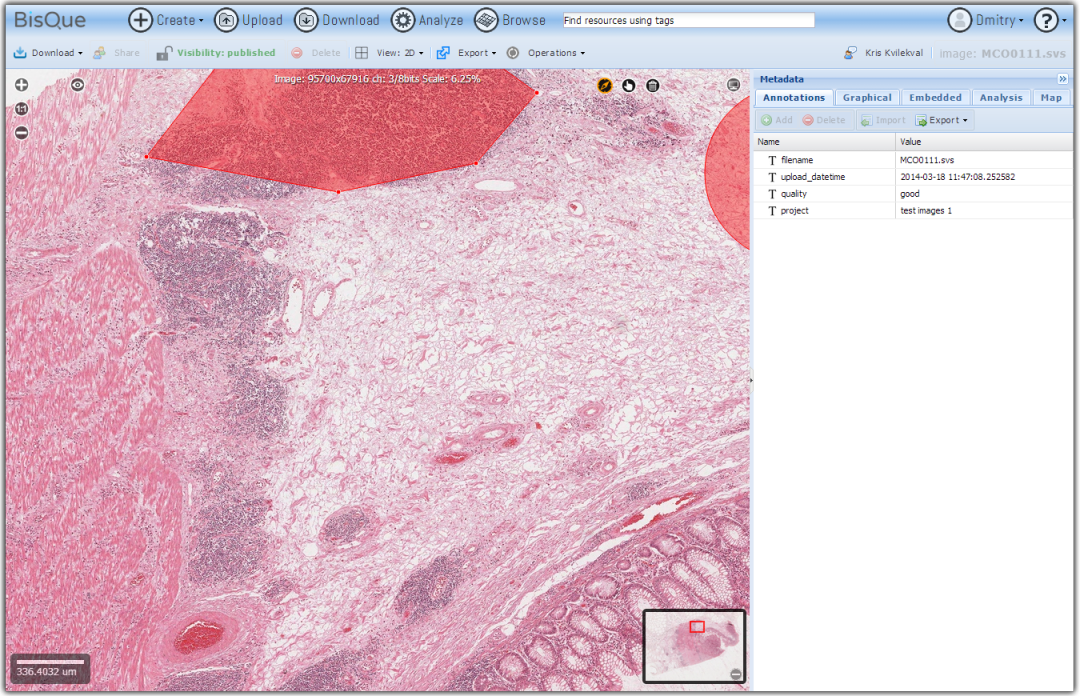
BisQue offers openslide support
Openslide allows reading whole-slide (very large planar) images in various formats: Aperio, Hamamatsu, Leica, MIRAX, Sakura, Trestle and generic tiled and pyramidal TIFF. Openslide's efficient library enables BisQue to read pixel data on demand and cache extracted tiles for better performance in the future. This translates into seamless visualization, annotation and analysis of images in all of the above formats. As usual all annotations are stored in the BisQue database and are not modifying the original files thus making BisQue a perfect tool for medical image analysis.
Images (hover): image 1


