Bio-Segmentation
 The UCSB Bio-Segmentation Benchmark dataset consists of 2D/3D images (Section 1) and time-lapse sequences that can be used for evaluating the performance of novel state of the art computer vision algorithms. Tasks include segmentation, classification, and tracking.
For each class of problem, at least one ground truth dataset is available. We also provide performance metrics for comparing the results of the algorithms with the ground truth. Additional ground truth data will be posted as they become available. Matlab code for performance evaluation is also available. If you use this dataset in your research please cite our ICIP'08 paper (see the citation below) in your publications.
The data is organized in 2 different ways, one based on image content type (subcellular, cellular and tissue level data) and the other one is based on the image processing methodology (segmentation or classification or tracking).
The CBI website is currently under migration and data sets will be available soon. For more information contact Dmitry Fedorov <fedorov@ece.ucsb.edu> or Kris Kvilekval <kris@cs.ucsb.edu>.
| Content Type | Type | Number of images | Size | Format | Channels | Condition | Species | Ground truth |
|---|---|---|---|---|---|---|---|---|
| Subcellular | view | 9 stacks | 512x600 | .tiff, .stk | Rhodamine | Taxol Docetaxel | Human (HUVEC) | download |
| Cellular |
2D nuclei : view 2D nuclei : download |
50 images | 512x512 768x512 | .tiff | TOPRO | Normal 3d detached | cat | |
|
Breast cancer : view Breast cancer : download |
58 images | 896x768 768x512 | .tiff | H&E | malignant benignant | Human | ||
| COS 1 kidney cells | 190 images | 1024x1024 | .tiff | Calcein Propidium iodide hoechst | 2,6,12,24,48 and 72h | monkey | 133 cells | |
| Tissue | Retinal images for boundary | 343 images | 300x200 | .bmp, .tiff | Rod opsin GFAP Isolectin B4 | Normal, 1-d, 3-d,7-d, 28-d detached | cat | 108 masks 91 boundaries |
| Algorithm | Image | Matlab Code for Evaluation | Input | Output | Result |
|---|---|---|---|---|---|
| MicrotubuleTracking | Microtubule | Microtubule Trace Evaluation | G objects, GT | 4 performance measures | 9.00% |
| 2D blob detector | 2D nuclei | 2D cell counting error | Cell count (1 number), GT | Error percentage, F-measure, distance error | 3.52% |
| 3D blob detector soon available | 3D nuclei | 3D Cell counting error | G objects (x,y, z coordinates), GT | Error in terms of count and position, F-measure | 0.18 |
| Cell Segmentation classification | Breast cancer cells COS 1 kidney cells | Cell number and shape discrepancy | Breast Cancer GObjects (GT) Kidney Cells Gobjects(GT) | Error penalizing shape and misdetections | 0.25 |
| Layer segmentation Boundary segmentation | Retinal images | F-Measure | .tiff labeled masks .tiff, .mat boundaries | Precision and recall | 88.00% |
Section 1 — by image content type
Subcellular level
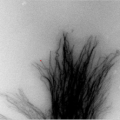
Microtubules are conveyer belts inside the cells. They move vesicles, granules, organelles like mitochondria, and chromosomes via special attachment proteins. Structurally, they are linear polymers of tubulin which is a globular protein. Researchers believe microtubules play a important role in the study of Alzheimer and in certain cancers. To obtain a quantitative description of behavior under different experimental conditions, researchers track individual microtubule traces manually. We focus here on microtubule time sequence images obtained by transmitted light microscopes. The challenges at this scale and with this acquisition modality are typical for in-vivo cell imaging: high clutter, gaps, and low signal to noise ratio.
Cellular level
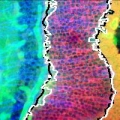
Photoreceptors in 2D Retinal Images
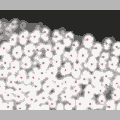
For example, in retinal images, the number of photoreceptor nuclei in the outer nuclear layer (ONL), depicted in this image, is one of the important measurements of the retina degeneration. UCSB retinal dataset consists of 40 laser scanning confocal images of normal and 3-day detached feline retinas (20 normal and 20 3-day detached). The detached retinal samples are obtained by surgically detaching a retina and leaving the animal in the detached retinal state for a certain period of time before imaging the tissue samples. Images were collected using a laser scanning confocal microscope from tissue sections. For each image, the ground truth, consists of an ONL binary mask and the corresponding manual cell count in the ONL layer by three different experts.
Breast Cancer Cell
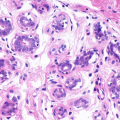
There are about 50 H&E stained histopathology images used in breast cancer cell detection with associated ground truth data available. Routine histology uses the stain combination of hematoxylin and eosin, commonly referred to as H&E. These images are stained since most cells are essentially transparent, with little or no intrinsic pigment. Certain special stains, which bind selectively to particular components, are be used to identify biological structures such as cells. In those images, the challenging problem is cell segmentation for subsequent classification in benign and malignant cells. The ground truth have been obtained for one image containing benign cells.
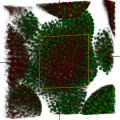
COS1 Cells
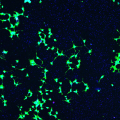
COS1 cells (immortalized African monkey kidney cells) are collected through confocal microscopy imaging. The images are of both wild-type COS1 cells (non-transfected) and tau transfected COS1 cells and these cells were imaged at 7 different timepoints after treatment (2hrs, 6 hrs, 12 hrs, 48 hrs, 72, hrs, and 120 hrs). The challenge in these images is to identify dead (red), alive (blue) and total number of cells (blue in green background). Ground truth has also been collected for this dataset and is represented by binary masks.
Photoreceptor in 3D Retinal Images
In the recent years the availability of 3D data increased dramatically. Such data can answer new questions and provide valuable insights. Therefore it is imperative to develop reliable analysis methods for 3D data. Consequently we have chosen one of the most basic operations such as cell counting for image and ground truth (GT) data collection, algorithm and evaluation development. While one can still do manual counting in 2-D, this is a practically impossible task with 3-D images. Furthermore, the scale difference between X-Y and Z dimensions might cause manual counting to be subjective and highly inconsistent, thus it's important to build robust and reliable automatic nuclei detector. Acquiring GT for 3D images is extremely tedious and slow, thus, we believe such a dataset can be of great value for image processing community. Because manual counting is extremely time-consuming the GT could only be acquired for small numbers of images. Currently we have 10 annotated images of Arabidopsis and feline retinas imaged by a laser scanning confocal microscope and constantly working on increasing this dataset.
Tissue level
Retina Layers (regions)
Retinal Boundaries
 Confocal microscope images of retinas taken during detachment experiments are critical components for understanding the structural and cellular changes of a retina in response to disease and injury. As the first step of any other analysis (e.g. before cell counting), it is crucial to have a reliable map of the retinal layers. Hundreds of retinal images and layer ground truth are part of the benchmark. Four major layers of the retina are segmented manually: the ganglion cell layer (GCL), the inner nuclear layer (INL), the outer nuclear layer (ONL), and the outer segments (OS).
Section 2 — how to evaluate the segmentation results
The user has different ways to evaluate the performance of their algorithms. The choices are:
- download the Matlab code to self-evaluate the algorithm performance,
- use web-based evaluator: http://ganga.ece.ucsb.edu:8080 to upload the analysis results in the correct format and run the web-based evaluator, the evaluation results will be automatically displayed on the web site.
Work based on the dataset should cite our ICIP '08 paper:
@inproceedings{Drelie08-298,
author = {Elisa Drelie Gelasca and Jiyun Byun and Boguslaw Obara and B.S. Manjunath},
title = {Evaluation and Benchmark for Biological Image Segmentation},
booktitle = {IEEE International Conference on Image Processing},
location = {San Diego, CA},
month = {Oct},
year = {2008},
url = {http://vision.ece.ucsb.edu/publications/elisa_ICIP08.pdf}}